


 Home >
 Knowledge Base >
 Community >
 Downloads >
Bode Plot Functions
Valid for S300, S700
Some general information
Production of Bode Plots for current controllers, speed controllers, and position controllers by means of the S300/S700. The aim is to evaluate the drive's dynamical behaviour, and to safely and fast determine and fix the controller's optimum parameters.
To determine the drive's transmission behaviour and dynamics, and to optimally parametrize the control circuits, for every level of the regulation cascade (current controller, speed controller, and position controller) the servo amplifier offers a separate software - based Bode Plot functionality. Although, with all three measuring functions the operation is similar, there are also differences to be observed.
Current controller: CBW (ASCII CMD), Current Bandwidth
The adjustment of the current control loop depends essentially on both the motor's inductivity, and the controller's idle time. For all AKM servomotors there exist optimized parameter sets. Mostly, further adaptations are not necessary.
For motors produced by other manufacturers, you can generate a Bode Plot for the current control circuit by means of the ASCII command "CBW." With the Bode Plot function it may be possible to damage the motor. Thus, this function is not generally available, and should only be applied by experienced users.
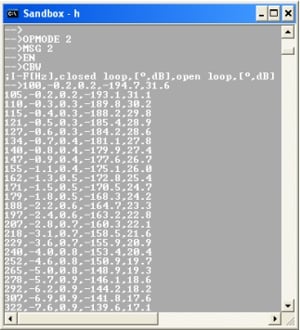 Picture 1: starting of the current 's Bode Plot inf the hyperterminal with heading and result. |
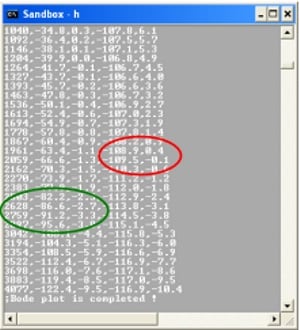 Picture 2: end of the current's Bode Plot; phase reserve: 70,5° (red), 90° band width: 2,7kHz (green) |
Proceedings
- For the current's Bode Plot the control unit must be situated in "OPMODE 2“ (current digital) .
- To test the controller's parameters the motor can be braked, and the response of a small current leap (T 0.1) can be measured with an oscilloscope. If the controller oscillates, KP of the current controller (MLGQ) must be lowered if need be, before the Bode Plot is carried out.
- DriveGUI: disconnect (Disconnect), start the hyperterminal. If necessary, turn off the check sum using PROMPT 133 .
- MSG 2 immediately shows the results (recommended mode). In other cases the result can be displayed by GET when the measuring is finished.
- CBW starts the current's Bode Plot.
- Display in the hyperterminal (picture 1): five colums separated from each other by commas. First column: frequency in Hz. This column is followed by two columns each for the closed and for the open control circuit displaying the phase angle in ° and the amplitude in dB. At the beginning, the headline is output with an I for the current's control circuit, and with the designations of the columns..
- You can stop the process any time using the commands STOP, DIS or K . However, stopping the process provokes an immediate disabling of the drive.
To prevent the motor from damaging, the process must be stopped immediately if the amplitude permanently rises above 7dB. In this case the current controller produces 5 times the rated electrical current, i. e., a maximum current that can amount to thrice the constant current admitted for this motor I0 (MICONT) . Under these circumstances mostly the amplification of proportionality (MLGQ) is clearly too high. - If you wish to have a graphic display the result can be charged and displayed in the Bode Plot mode of the DriveGUI by pressing the "Refresh" button.
Result
Depending on the adjusted switching frequency, resp. the current's update (DPWM) the Bode Plot is carried out for different frequency sectors. In the beginning the frequency is always 100Hz. For a switching frequency of 8 kHz and a current's update of 16 kHz (DPWM 0) the maximum frequency of the Bode Plot amounts to 4200 Hz , and for 16/32kHz (DPWM 1) it amounts to 8000 Hz; here the measuring process takes correspondingly longer. These sectors cannot be changed.
Besides the possibility of graphical display by means of the DriveGUI (see above) already the tabular display makes it possible to read the important parameters (picture 2). The band width of the current's control circuit is a quantity to measure the drive's dynamics. This frequency value is read where either
- the phase respond of the closed control circuit intersects the -90° line (green mark: 2.7 kHz),
- or where the amplitude response intersects -3 dB.
The lesser value describes the band width. The amplitude and the phase reserves are read at the open control circuit. In picture 2 the frequency where the phase reserve is visible, is marked in red (180°-109,5°=79,5°).
Parameters
The Bode Plot for the current can be started with a parameter (CBW {Imax}) which establishes the maximum value for the full sine system (in Arms).
The default value for this parameter depends on the servo amplifier's output current, and on the nominal voltage of the connected motor. (Imax_default = Min {0,4 * I0motor;0,2 * I0amplifier}).
The peak value of the impressed voltage can be increased up to a maximum value (Imax_lim = Min{0,4 * I0motor;0,4 * I0amplifier;3A}). Normally, the height of the standard amplitude suffices completely, so that an increase is not necessary. In case the motor's current load shall be limited, it can make sense to lower this value.
Speed controller: VBW (ASCII CMD), Velocity Bandwidth
The servo amplifier's most important Bode Plot Function is the Bode Plot Function of the velocity control circuit. It can be started either from a hyperterminal with the command VBW, or within the setup soft ware DriveGUI.
The way the velocity control circuit is parametrized depends on many factors, and is in general the most demanding task when adjusting the controller. Normally, on this level mechanical resonances are clearly perceptible, or visible. Thus, Servostar's software offers serveral different observers and filters which greatly influence the controller in its speed range. With the Bode Plot tool, the effects of these elements can be very well measured and visualized.
Caution ! During the measuring process, the motor shaft is constantly oscillating. Please do not disregard that this may provoke oscillations within the connected mechanism. In this way, very strong mechanical resonances can provoke errors which result in the motor's uncontrolled phasing - out.
Procedure
For the velocity Bode Plot, the control unit must be adjusted to OPMODE 0 (digital velocity ).
Starting from "DriveGUI"
To start the measuring procedure, you must first call "Bode Plot“ in the directory tree, and then click "Bode Plot" on top of the page. In the basic adjustment, the amplifier records twenty measured values that range between 20 and 500 Hz. Within the submenu "Parameters…" on the same page you can adapt this measuring range to your necessities. Especially in case of resonances that occur very narrow - banded in the upper measuring rang, we recommend to enlarge the number of measuring points (steps) to exactly picture the effect. Thus the measuring procedure is extended correspondingly.

Picture 3: Bode Plot velocity within the DriveGUI open servo loop (green), and closed servo loop (red)
At the end of the measuring process, the results for both the open (green) and the closed servo loop (red) is displayed in the Bode Diagram (picture 3). By clicking the "Stop" button, you can finish the measuring process at any time before it is finished. In this case the result obtained until the interruption is displayed.
Using the commands "Save" or "Load" you can save or load measurements from this window. If the "Refresh" button is pressed, the last memory contents of the control system are visualized on the screen again. Indeed, the oscilloscope uses the same memory. If a picture has been recorded with the oscilloscope, the display remains blank.
Starting from the hyper terminal
Like in the current's Bode Plot, it is possible to display the results immediately (recommended mode) with MSG 2. Otherwise, when the measuring process is finished, the result can be displayed by means of the command GET. The velocity's Bode Plot is started with the command VBW. Here, different from GUI, in the basic adjustment, the amplifier records thirty values between 20 and 800 Hz.
The display indicates five columns which are separated by commas. The first column shows the frequency in Hz. The next two columns, valid for the open and for the closed current circuit, indicate the phase angle in °, and the amplitude in dB. In the beginning, a headline is displayed indicating a V (Velocity) for the velocity control circuit, and the designations of the columns.
If you want to implement different measuring bases, you must transmit them from the hyper terminal as parameters using the command VBW (VBW {fmin} {fmax} {samples} {switch}). These parameters indicate the starting of the measuring process, the maximum frequency, and the number of measuring bases. With the last parameter you can turn off all filtering functions.
If later the result shall be depicted in the DriveGUI this is done by pressing the "Refresh" button.
Filter Func.
In addition to the possibility to produce a Bode Plot of the existing system, in the setup software DriveGUI it is possible to predict the effect of one of the velocity control circuit on the cut - open servoloop without directly having to produce a Bode Plot using the option "Filter Func.“ Picture 4 illustrates this with a BiQuad filter. The green curve continues to show the (measured) open servo loop without the additional filter. The red curve in this illustration does not show the closed servo loop but it only shows the filter's transmission function as set in advance by the parameters in the sub menu. The blue curve shows the resulting cut - open servo loop in this additional filter.
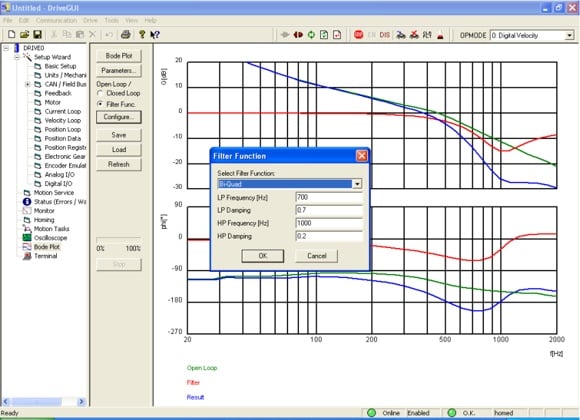
picture 4: Bode Plot velocity in the DriveGUI with filtering function: open servo loop (green), filter (red), and resulting open servo loop (red) with filter
Before such calculations are carried out we recommend to draw up a Bode Plot completely without filter in the servo loop as otherwise it is not easy to realize the filter's determined adjustments. When undertaking measurements without filters in most cases you have to reduce the proportional sensitivity GV. The amplitude of the inciting signal is inversely proportional to GV!
Position control: PBW (ASCII CMD), Position Bandwidth
It is also possible to produce a Bode Plot for the exterior (position) control loop. It considers all active elements within the position control loop including the feed forwards as far as they are calculated internally in the servo amplifier.
To check the stability, you must first turn off the feed forward controls.
Prior to that you should carefully adjust the velocity control circuit so that no resonance sharpness can be produced. Otherwise, these resonance sharpnesses would have too strong effects inside the position control circuit.
In the basic adjustment, the electrical excursion of the motor ' s rotor is at most about 3°. The program will try to reach this position. Thus, you must also grant that this is possible from the mechanical point of view. Otherwise, the initial amplitude must be lowered correspondingly (see below).
In the upper frequency range, the program automatically lowers down the electrical excursion so that the amplifier's current load doesn't get too high.
The function to position the Bode Plot can only be obtained from the hyper terminal.
Procedure
For the Position's Bode Plot the amplifier must be adjusted to OPMODE 8 (digital position).
- DriveGUI: disconnect, start the hyper terminal. If necessary use PROMPT 133
- MSG 2 (recommended mode) immediately displays the results. Otherwise the result can be displayed by the command GET.
- PBW starts das Position Bode Plot. In the basic adjustment, the control unit record fourty values between 20 and 1500 Hz.
- Display in the hyper terminal (picture 1):
Five columns separated by commas. First column: frequency in Hz followed by two columns each for the closed and for the open servo loops displaying the phase angle in ° and the amplitude in dB. In the beginning, there is output a headline showing a P indicating the closed loop position control (position), and designing the columns. - Using the commands STOP, DIS, or K, you can stop the procedure any time you like. This provokes an immediately disabling of the drive.
- If you wish to obtain a graphic display, the result can be loaded in the Bode Plot mode of the DriveGUI by pressing the "Refresh" button.
Parameters
If you want to choose different bases for the measurements, these are transmitted from the Hyperterminal as parameters by the PBW command (PBW {fmin} {fmax} {samples} {excursion}. The last parameter indicates the excursion in counts. Here, the default value is 2048 counts which corresponds to 2,8° electrical. The maximum possible excursion is 8192 counts, or 11,2° electrical
Overview
CBW Bode Plot in the current controller
Hyperterminal
Parameter: CBW {Imax}
VBW Bode Plot in the velocity controller
Setup software or Hyperterminal
Parameter: VBW {fmin} {fmax} {samples} {switch}
PBW Bode Plot in the position servo loop
Hyperterminal
Parameter: PBW {fmin} {fmax} {samples} {excursion}
